

Kent State researchers develop new way to observe Lake Erie algal blooms
September 16, 2019
Scientists at Kent State have developed a new way of observing Lake Erie’s harmful algal blooms that could help improve studying the lake’s health.
A team of graduate and undergraduate students led by geology professor Joseph Ortiz have developed a novel strategy of collecting and studying satellite images of Lake Erie’s toxic blooms through spectral imaging, a method similar to micro-fingerprinting.
Lake Erie has consistently harvested harmful algal blooms in the western basin, near Sandusky and Toledo. The toxic content in these blooms is what makes them so harmful.
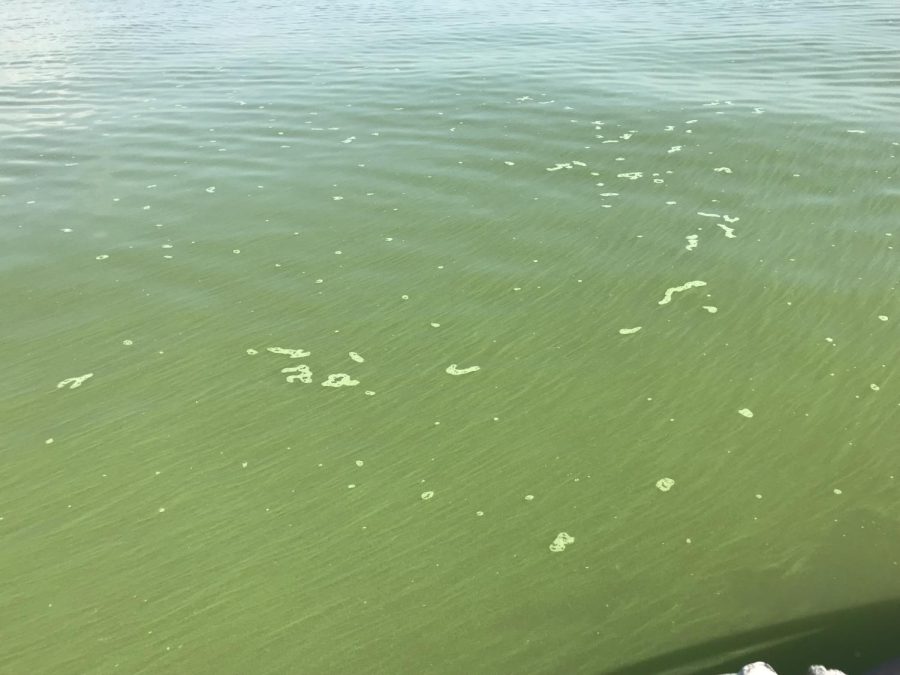
Ortiz explained that harmful algal blooms are generated by ancient organisms called cyanobacteria, which cultivates as the blue-green sheen on Lake Erie’s western shores.
These cyanobacteria thrive best in the warm and shallow waters of Lake Erie’s western basin and have been producing toxins with serious implications.
In August 2014, 400,000 Toledo residents had their water cut off after high levels of toxins from that summer’s bloom were detected in drinking water.
“For various reasons, cyanobacteria tend to produce toxins of different types,” Ortiz said. “Those are the ones we refer to as harmful algal blooms.”
The most abundant harmful algal byproduct found in Lake Erie, is the hepatotoxin microcystin.
“Microcystin LR attacks the blood and liver,” Ortiz said. “In high concentrations it can lead to acute liver failure and death which is a very uncommon event. In low concentrations there is some evidence it potentially leads to liver cancer.”
While not everyone is rushing to dive into the green sludge to infect themselves, microcystin still has a potentially more sinister way of affecting people not in direct contact with the toxic water.
“Bioaccumulation is when a small organism feeds on an organism that has a toxin in it and passes the toxin unto itself,” Ortiz said. “Then that organism gets eaten by something bigger and concentrates the toxin even further.”
Researchers at Ohio State University are developing new methods to test toxin accumulation levels within the edible muscle tissue of fish.
A 2015 preliminary test from these studies found there was a small amount of toxin absorbed. However, the samples were not collected during peak bloom season, which, for Lake Erie, is September according to the National Oceanic and Atmospheric Administration.
There is also research on using the contaminated water on crops.
“This is a big problem for everybody that’s involved here,” Ortiz said. “Not just for people that recreate on the water or have waterfront property or the fisherman, but also for the farmers that are making a livelihood and also the consumers in the area that want to know the products they are getting are safe to eat.”
Ortiz and the team of graduate and undergraduate researchers are fingerprinting the lake’s harmful bloom to get a more accurate and accessible depiction of the bloom’s composition.
“In my lab we are looking at the pigments associated with these organisms,” Ortiz said.
This is done through a technique of spectral imaging where wavelength absorption data, captured by satellite images of Lake Erie are used to identify specific color producing agents in the harmful algal blooms.
Ortiz’s team has improved this method by being able to separate different signals that correlate to different pigments within the bloom for a more accurate and detailed image.
These images were also confirmed by ground samples collected from the lake, to validate the readings of the satellite.
“The advantage that this method has over the existing approaches is more specificity,” Ortiz said. “So rather than just saying how big the bloom is, we can separate the bloom and partition it into different parts associated with different types of algae. So we can pinpoint where the real trouble spots are.”
Nick Manning, a senior double majoring in geology and environmental studies, was part of the team tasked with collecting the ground samples.
Manning explained it like this: “If you have a bottle of Pepsi, you can look in and see the brown liquid but you can also read the ingredient label and it will tell you everything that’s mixed in. So what we’re doing is creating an ingredient label.”
Through this method, a spectral library specific to Lake Erie’s harmful algal blooms has been produced and pigment signals can be matched like fingerprints.
“Each byproduct produces its own spectral signature which is kind of like its own fingerprint,” Manning said. “The fingerprints can be matched to the signals in the image to tell you what’s in the water.”
This is helpful in quick identification and surveys of Lake Erie’s algal blooms which covered around 300 square miles this summer according to a Michigan Live weather report.
Sampling such a massive space like Lake Erie could take weeks and waiting for lab results is even longer. The detailed satellite imaging expedites the process and opens up opportunities for further investigation of Lake Erie’s harmful algal blooms over time.
Ortiz explained the blooms have been aggregated by fertilizer runoff from farms. Algae nutrients in the form of nitrogen being dumped into the lake from fertilizer has ignited algal growth which has depleted oxygen from large parts of the lake.
“There’s evidence worldwide that the number of harmful algal bloom events have been increasing over time because of human touch on the landscape,” Ortiz said. “When we put nutrients in the form of fertilizer on the fields and nutrients wash off the farmland into the lakes and rivers they feed nutrients into the environment.”
This runoff has led to massive algal blooms in the past. A research study published in Proceedings of the National Academy of Sciences of the United States of America confirmed that it was farming fertilization runoff that led to Lake Erie’s record breaking 2011 harmful algal bloom that covered a total 2,000 square miles.
“They are growing more and more and there are problems with that because they are covering more surface of the water blocking sunlight from the plants in the water that need that sunlight,” Manning said. “When they are eating they use up a lot of oxygen in the water creating hypoxic zones.”
Manning explained hypoxic zones as areas in the water where oxygen levels are extremely low and can lead to fish and other organisms dying.
Manning hopes the images and data collected from this research can help organizations like NASA and the National Oceanic and Atmospheric Administration by providing more accurate information to help with decisions on possible farming regulations.
“We want to help their satellite images be as accurate as possible because if they’re going to start making regulations or calls based solely on that area, we want them to be as accurate as possible,” Manning said.
Ortiz, who has used this method in other areas like Florida and the U.S. Virgin Islands where it is used to survey coral health, said the imaging method could also be used to monitor erosion rates and fish health.
“It’s important to have everyone pay attention to what’s going on around them and different environmental issues,” Manning said. “There’s a lot happening even in our own areas and our own backyards.”
Contact Colleen Carroll at [email protected].