
It’s watching you
April 20, 2006
Eye Tracker in usability lab helps determine data
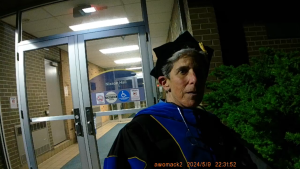
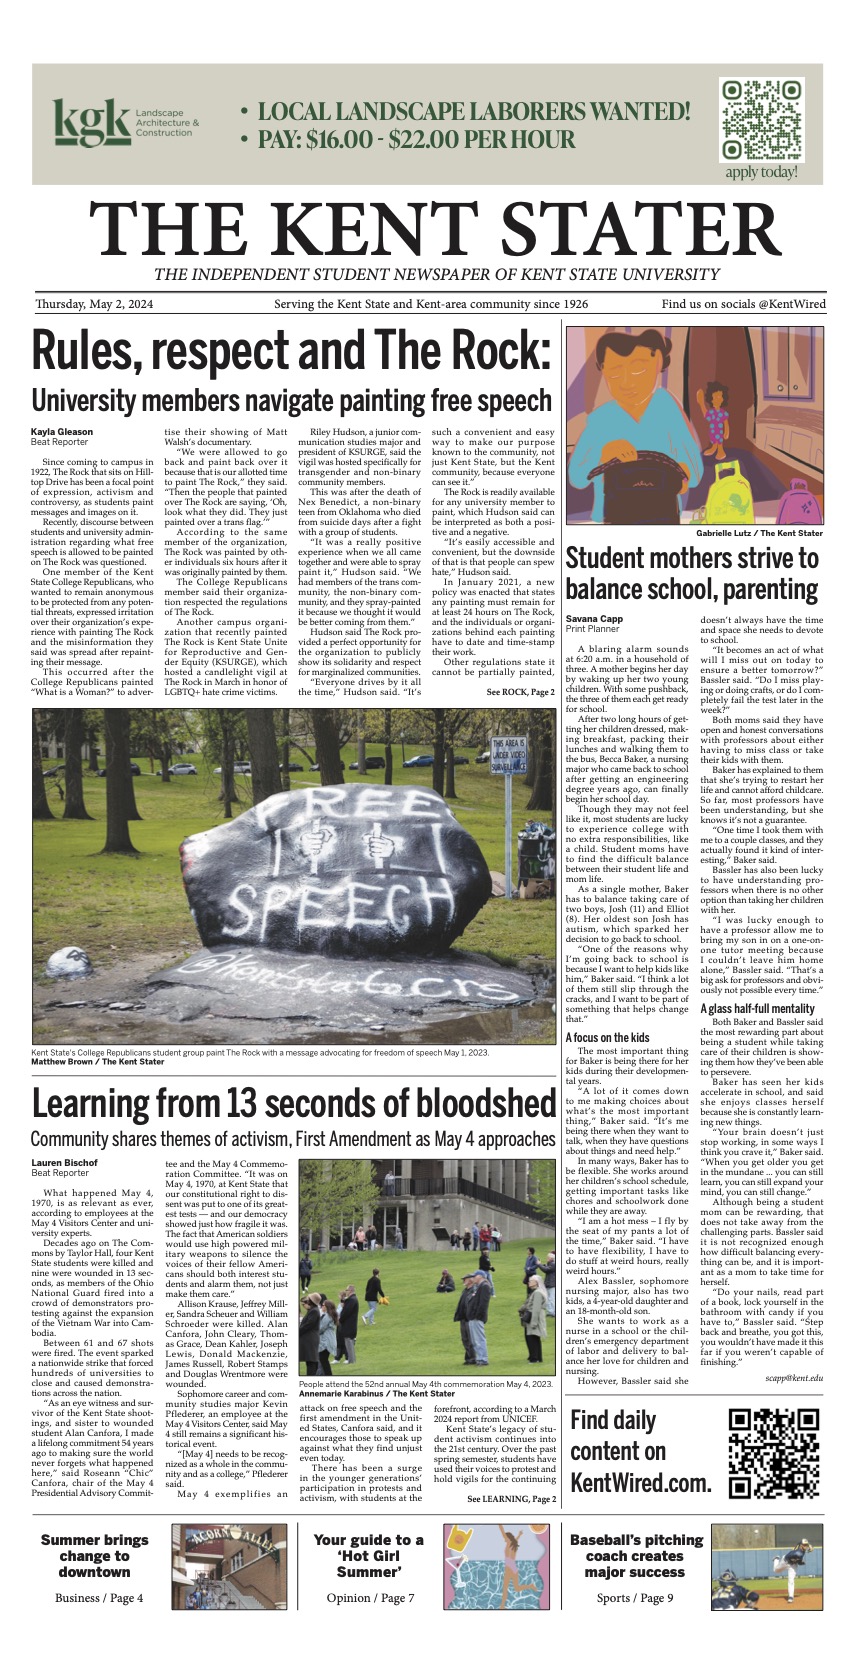
David Robins, assistant professor in the College of Communications and Information, demonstrates how the Tobii eye tracker works. The blue dot and line are a representation of where the subject’s eyes were focused while being presented with a slideshow. M
Credit: Carl Schierhorn
The usability lab located on the third floor of the library looks like an ordinary conference room until you see the Tobii Eye Tracker, the ominous looking machine on the right-hand side of the desk.
The Eye Tracker looks like Darth Vader’s personal computer the display features several jagged corners and is colored jet-black. As you sit in front of the monitor, the machine calibrates to your eyes with embedded infrared cameras, as a pair of dots representative of your pupil placement show up on the screen.
“Younger people without glasses calibrate the best,” David Robins said.
Robins, assistant professor in the College of Communications and Information, said the machine’s cameras have a range of two feet and refresh once every 20 milliseconds.
SLIS acquired the Eye Tracker in July 2005. With all of the software included, the machine cost the school approximately $30,000.
“You can do usability testing without it, but more of the sophisticated tests are using this,” Robins said. He also likes the fact that the Eye Tracker is non-intrusive and more passive when compared to some of the other usability testing devices, some of which involve forms of headgear.
“If we were shocking people when they did the wrong thing, we’d have to get a lot of approval for that,” Robins said.
The experiment
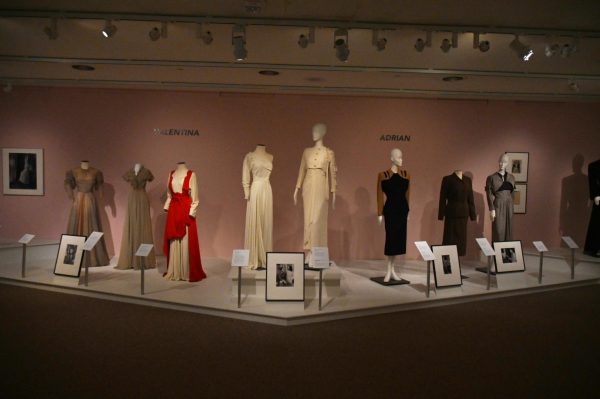
After the calibration, Robins demonstrated a test in which several pieces of artwork were shown for a few seconds at a time. After a couple minutes of examining the paintings, he pulled up a gaze plot a video replay of where the subject’s pupils were fixated during the experiment.
Robins was also capable of generating a compilation of hot spots, which looked like the Doppler-radar screens you would see during a television of a weather broadcast. The hot spot compilation indicated where the subject was looking and the intensity of what they were viewing, indicated by a color scale that ranged from green (low intensity) to red (high intensity).
Finally, the Clearview tracking software created a meticulously detailed spreadsheet in Microsoft Excel. The spreadsheet showed what the subject’s eyes were doing at 20 millisecond intervals ranging from the individual position of the pupils to their size.
“It’s like an ant’s view of a shopping mall,” Robins said.
The amount of data collected by the Eye Tracker can be staggering Robins said a 10-minute study is capable of compiling 1 to 2 gigabytes of data. A study Robins did of 135 students in Shaker Heights resulted in 270 gigabytes worth of data, although he said typical studies only involve 5 to 20 subjects.
Robins said artists could also use the Eye Tracker to their benefit in order to test how effective their paintings are.
“They (artists) could use it to see whether or not people are paying attention to the things they intended for people to pay attention to,” he said.
One of the Eye Tracker’s flaws is that is capable of crashing like any other computer. During a second test, the Eye Tracker crashed, which resulted in a loss of data. Robins said the loss of data is incredibly crucial when you consider the nature of the tests.
“You can’t repeat the study in order to get the same response,” he said.
Contact College of Communication and Information reporter Ben Breier at [email protected].